|
| Navigation<> |
The 1.5-T Philips Intera system at the Peninsula MR centre was used for this study. Functional scanning was performed using a one-shot EPI sequence (TR/TE = 3000/50 ms; flip angle = 90°; FOV = 230 mm; slice thickness = 4 mm; 64×64×32 matrix).
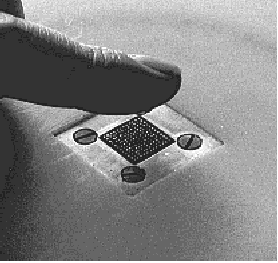
 Array stimulator with 100 independent contactors.
The Exeter 100-element tactile array was used to produce virtual touch sensations on the index finger of 8 subjects during fMRI. Moving stimuli were produced by sequentially vibrating the ten adjacent rows of the array, with 9 "sweeps" over the 12 s stimulus block. For stationary stimuli, all rows of the array were vibrated simultaneously., using a similar timing pattern. Stimuli produced by vibration at 40 Hz and stimuli produced by vibration at 320 Hz were tested in separate sessions.
The subjects were divided into two groups. For the first group, the 40 Hz stimuli were presented first and the 320 Hz in the second session, whereas for the second group the 320 Hz stimuli were presented in the first session and the 40 Hz in the second session. Each session consisted of an unpredictable sequence of stationary and moving stimuli and lasted for 14.7 minutes (288 scans). The stimulus ON period of 12 s was followed by a resting OFF period of 33 s.
Subjects were required to attend to the stimuli and make a decision on whether each stimulus was "stationary" or "moving by pressing a corresponding key.
The fMRI data were analyzed using SPM2. The standard MNI brain tameplate was used. A one sample t-test was conducted to examine the stimulus-specific activation (moving or stationary, compared to baseline rest) at each of the two stimulus frequencies. Paired t-tests were also performed to compare activations between moving and stationary stimuli, again at each of the two stimulus frequencies.
 Group analysis for contrast between stationary vs moving stimuli
(pooled 40 Hz and 320 Hz data), pcorrected = 0.05.
The activity due to vibrotactile stimuli is clearly recorded in the somatosensory cortex and motor cortex, throughout all the subjects. Both the movinig and stationary tactile stimuli produce significant activation of SI, SII and the posterior parietal complex [1,2,3].For 320 Hz stimuli, activation is significantly enhanced for moving stimuli compared to stationary stimuli (p = 0.05, corrected), predominantly in a region corresponding to Brodmann area 40 (contralateral). For 40 Hz stimuli , a similar result was obtained at a lower significance level of p = 0.001 (uncorrected) but not at p = 0.05 (corrected). Analysis of data pooled over 40 Hz and 320 Hz (p = 0.05, corrected) show a similar result to the 320 Hz only case. These observations are in contrast to results from a previous study [1], where moving vs stationary comparison indicated the bilateral involvement of MT/V5.
This was supported by EPSRC and ROSANA (IST-2001-34892). Thanks to Philips Medical Systems for scientific support